In 2024, I adopted an innovative approach to investing, inspired by automation. Instead of spending countless hours researching promising stocks, I considered aligning myself with the strategies of the wealthy. These individuals surround themselves with the best wealth managers to optimize their portfolios. Fortunately, the details of their investments are accessible thanks to transparency legislation, particularly the Stock Act.
This article aims to examine the stock acquisitions of American senators in 2023, highlighting the overall performance of their portfolios.
Let’s demystify everything.
The Stock Act in brief
The Stock Act is an American regulation that requires senators to disclose their stock trades. This law provides a maximum reporting deadline of 45 days after each transaction.
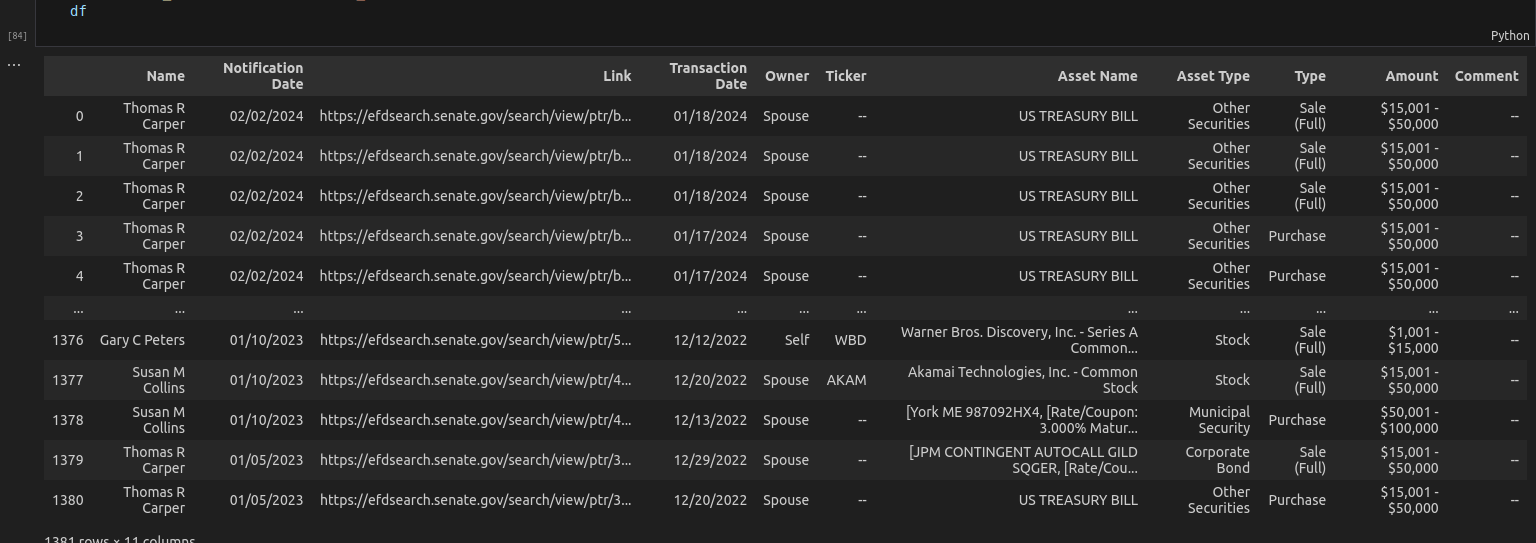
Data Collection Methodology
Data collection was done using a programmed robot to navigate the official website in the absence of a dedicated API. This process compiled all 2023 transactions into a dataframe after careful data cleaning and formatting.
Key Observations
Reporting Delays
On average, transaction reports in 2023 were made 36 days after the operations, thus complying with the Stock Act’s guidelines.
Transaction Activity
The analysis revealed a wide range of activities, from purchases to significant sales, highlighting the diversified strategies of the investors.
Most Active Senators in Stock Transactions
The following table lists the most active American senators in the stock market in terms of the total number of transactions (sales and purchases) carried out in 2023.
| Senator | Transactions |
|---|---|
| Thomas H Tuberville | 290 |
| Markwayne Mullin | 148 |
| Daniel S Sullivan | 97 |
| Thomas R Carper | 96 |
| Jerry Moran | 45 |
| Shelley M Capito | 42 |
| Sheldon Whitehouse | 29 |
| John W Hickenlooper | 26 |
| John P Ricketts | 25 |
| John Boozman | 24 |
Thomas H Tuberville stands out as the senator with the highest number of transactions, both in purchases and sales.
Detailed Analysis of Thomas H Tuberville’s Transactions
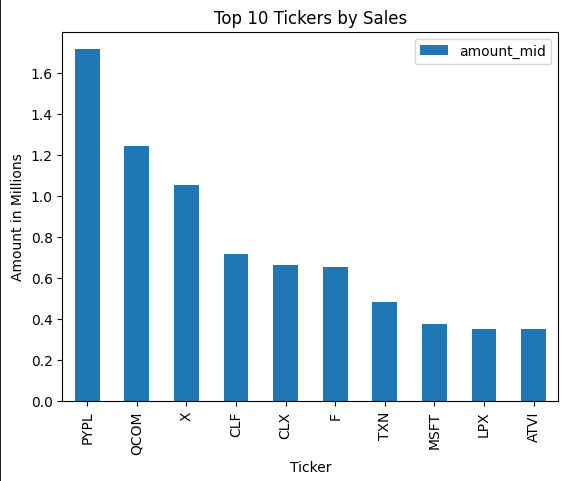
Let’s take a closer look at Thomas H Tuberville’s significant investments, highlighting transactions valued at $20,000 and above.
| Company (Symbol) | Amount Invested ($) |
|---|---|
| PYPL | 1,714,006.0 |
| QCOM | 1,241,004.5 |
| X | 1,053,009.5 |
| CLF | 718,507.0 |
| CLX | 663,004.0 |
| F | 655,003.5 |
| TXN | 481,004.0 |
| MSFT | 375,000.5 |
| LPX | 350,001.0 |
| ATVI | 350,001.0 |
| KMB | 347,502.5 |
| CVX | 250,001.0 |
| GOLD | 239,003.5 |
| NU | 215,501.5 |
| KR | 182,501.5 |
| HPQ | 130,002.0 |
| PARA | 107,501.0 |
| KEY | 89,002.5 |
| UAA | 81,002.0 |
| FGBI | 72,503.0 |
| MMM | 72,503.0 |
| CSCO | 65,001.0 |
| ANET | 65,001.0 |
| VZ | 56,502.0 |
| WBA | 56,502.0 |
| RF | 40,501.0 |
| MPWR | 40,002.5 |
| DIS | 32,500.5 |
| AAPL | 32,500.5 |
| PRU | 32,500.5 |
| OXY | 32,500.5 |
| META | 24,001.5 |
| MCO | 24,001.5 |
| RRC | 24,001.5 |
| ABBV | 24,001.5 |
| NSC | 24,001.5 |
| MMC | 24,001.5 |
| TSLA | 24,001.5 |
| ITW | 24,001.5 |
| HUMA | 24,001.5 |
| GSK | 24,001.5 |
| SKY | 24,001.5 |
| PHM | 24,001.5 |
| CRUS | 24,001.5 |
| DIOD | 24,001.5 |
| CBSH | 24,001.5 |
| A | 24,001.5 |
This list illustrates Tuberville’s strategic placements, favoring large-cap companies and diverse industrial sectors.
Conclusion
This exploration of senators’ investment behaviors offers valuable insights into wealth management strategies.